Background: Thrombophilia diagnosis can often be a convoluted process involving collection and analysis of clinical data, specialized laboratory testing, and high-level decision-making. This is inherently subjective due to differences in the clinical practice philosophy of each individual practitioner and can vary depending on institutional guidelines and available resources. Patient care and clinical outcomes may be affected as a result, which in turn provides a potential opportunity for optimization of thrombophilia diagnosis using AI.
Methods: This retrospective study evaluated the utility and effectiveness of an AI-powered algorithm (XGBoost) programmed to replicate the process of thrombophilia diagnosis. A total of 256 patients were referred by their clinician for thrombophilia evaluation at our ambulatory coagulation clinic between November 2019 and February 2023 and clinical and laboratory data were collected from the electronic medical record. Thrombophilia diagnosis was established (or ruled out) on the basis of the patients' personal and family history of thrombosis as well as according to the results of thrombophilia testing including established acquired and inherited thrombophilia risk factors. The XGBoost, a gradient boosting algorithm for supervised learning, was used to perform a randomized search over a predefined set of tree parameters and to find a well-performing configuration on the data using cross-validation. The dataset contained 12 clinical data parameters and 26 laboratory data parameters. The target variable was two-dimensional, consisting of the thrombophilia probability score and thrombophilia risk factors. Thrombophilia probability scores were calculated based on clinical data from the following criteria: one point assigned each for a) spontaneous thrombotic event; b) mild risk situation; c) recurrent thrombosis; d) atypical thrombosis localization; e) age <50 years at the time of first thrombosis; f) family history of thrombosis and/or first degree relative with an established thrombophilia diagnosis. A probability score of 0 points corresponded to “unlikely thrombophilia”; 1-2 points “thrombophilia cannot be excluded”; 3 points “likely thrombophilia”; and 4+ points “most likely thrombophilia”. Thrombophilia risk factors were categorized by a scale of 0-3 indicating no risk (0), low risk (1), intermediate risk (2), and high risk (3).
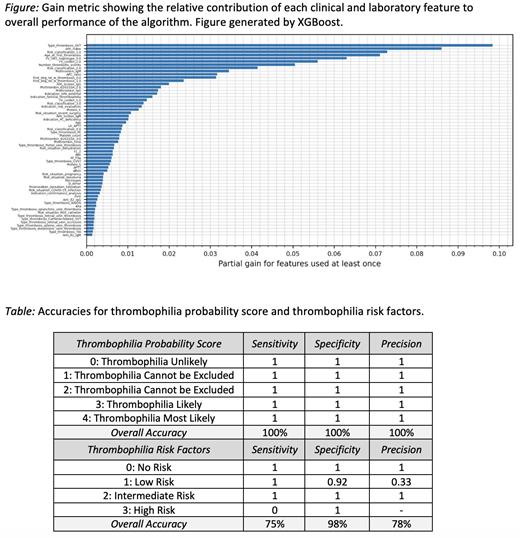
Results: Six patients were excluded from analysis due to lack of availability of sufficient clinical data. Clinical and laboratory data from the remaining 250 patients were thus included in the XGBoost analysis. The resulting trees and associated feature importance rankings revealed decisive factors for the detection of thrombophilia and suggested modified thresholds (e.g. age at the first occurrence of thrombosis increased from 50 years to 51.5 years) for an objective and standardized diagnostic procedure. The relative contribution of each clinical and laboratory feature to overall performance of the algorithm is shown in the Figure. The dataset was divided into three subsets: 200 train data, 25 validation data, and 25 test data, ensuring a representative distribution across the evaluation process. The model ultimately showed a sensitivity of 100% and a specificity of 100% for the thrombophilia probability score, and a sensitivity of 75% and specificity of 98% for the thrombophilia risk factors (Table).
Conclusion: These results highlight the utility of tree-based AI models to support the objective and complex diagnosis of thrombophilia and thrombosis risk stratification. Furthermore, medical professionals can gain helpful insights from this AI-powered decision-making process due to the explainable nature of the model. We expect that the algorithm will show a higher sensitivity and specificity for the thrombophilia risk factors when we repeat the tests with a larger data set, which is currently ongoing.
Disclosures
Rühl:Bayer, CSL Behring, Grifols, Novo Nordisk, Shire, Swedish Orpahn Biovitrum: Other: Reimbursement of travel expenses. Pötzsch:ImmBioMed: Patents & Royalties.


This feature is available to Subscribers Only
Sign In or Create an Account Close Modal